
With more than 100,000 miles of streams, 550 lakes, reservoirs, snowpack, ditches, diversions and groundwater, understanding Colorado’s sources of water supply is challenging. On the demand side, between agriculture, municipalities, environmental, recreational, industry, West Slope rural, and Front Range population centers, our water usage is also complex. Fortunately, the members of the South Platte and Metro basin roundtables have thought deeply about this issue and have developed an online educational resource about the hydrology in our state.
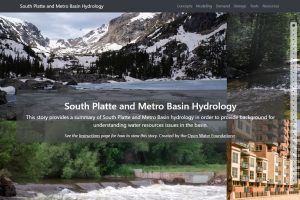 Called the South Platte Data Platform, this Hydrology Storymap (available on Southplattebasin.com/Stories) integrates vast amounts of statewide water data with an emphasis on the South Platte Basin. The purpose is to describe natural hydrology concepts such as streams and watersheds. Additionally, it delves into other issues which impact Colorado such as water rights. Much historical information is provided, such as drought and snowpack figures, as well as direct links to real-time data, providing up-to-date snow water equivalent, active stream gauge readings, and many other useful statistics.
This resource was designed with both technical water professionals and the general public in mind. Click-through buttons easily connect to other websites such as the Division of Water Resources, the United States Geological Survey, and Colorado’s Decision Support System to provide a one-stop technical resource for sophisticated research or reporting purposes. In addition, simple language, and graphic devices including embedded video and detailed platform instructions make the Storymap helpful for the general public as well.
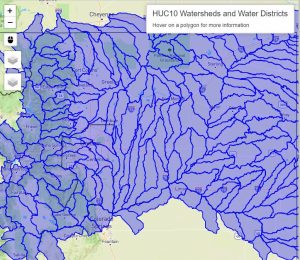 Examples of data include detailed maps of watersheds, resources for understanding return flows and schematics of approximately 500 nodes on the Statemod model (which estimates current and future water supplies) which were used in the development of the Statewide Water Supply Initiative (SWSI). Tools are also available which provide information on the 3,500+ diversion structures and 13,000 wells in the South Platte River Basin.
Other visualizations show the irrigation water requirements for crops grown in select locations in eastern Colorado, for example in general, alfalfa requires the most water, followed by sugar beets. The water demands of municipalities are also illustrated in an interactive tool showing total water demands of Denver, Aurora and Boulder.
For a given stream reach, flows necessary to protect environmental and recreational uses can be highly varied and also vary within a year. Another interactive visualization shows the flows needed for some environmental and recreational attributes on the South Platte River below Chatfield Reservoir, as well as the streamflow that was actually present during that time.
Within the South Platte Basin, flows can vary between sub-basins within the same year, with one sub-basin experiencing drought and another experiencing adequate water supplies. Variations can occur because of elevation, regional weather patterns, water storage projects, impacts of specific storm events and other reasons. The platform includes interactive visualizations which show supply variations due to elevation, regional weather patterns, water storage projects, storm events and other causes. Specific information about headgates is also included in a map along with links.
Through collaborative work with Open Water Foundation and generous grants through the South Platte and Metro basin roundtables and the Colorado Water Conservation Board, the roundtables have produced a very useful and timely resource. Please head to southplattebasin.com/Stories or contact Lacey@coloradowater.org for more information.
 Print
Print